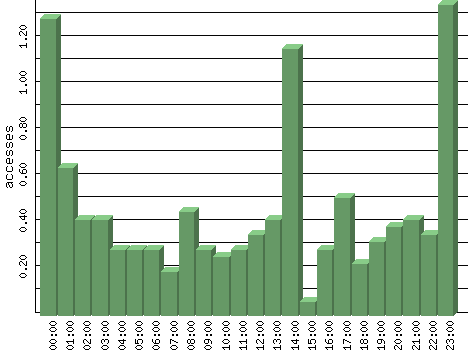
Figures are averages for that hour of each day in the time period analyzed.
| Hour | Accesses | % | Bytes | % | Visits | % | Bits per Sec | Bytes per Sec |
|---|---|---|---|---|---|---|---|---|
| 00:00 | 1.29 | 11.73 | 50.55 | 0.39 | 0.00 | 0.00 | 0.11 | 0.01 |
| 01:00 | 0.65 | 5.87 | 117.68 | 0.91 | 0.00 | 0.00 | 0.26 | 0.03 |
| 02:00 | 0.42 | 3.81 | 80.52 | 0.62 | 0.00 | 0.00 | 0.18 | 0.02 |
| 03:00 | 0.42 | 3.81 | 80.52 | 0.62 | 0.00 | 0.00 | 0.18 | 0.02 |
| 04:00 | 0.29 | 2.64 | 49.55 | 0.38 | 0.00 | 0.00 | 0.11 | 0.01 |
| 05:00 | 0.29 | 2.64 | 145.26 | 1.12 | 0.00 | 0.00 | 0.32 | 0.04 |
| 06:00 | 0.29 | 2.64 | 93.23 | 0.72 | 0.00 | 0.00 | 0.21 | 0.03 |
| 07:00 | 0.19 | 1.76 | 37.16 | 0.29 | 0.00 | 0.00 | 0.08 | 0.01 |
| 08:00 | 0.45 | 4.11 | 74.32 | 0.57 | 0.00 | 0.00 | 0.17 | 0.02 |
| 09:00 | 0.29 | 2.64 | 43.35 | 0.33 | 0.00 | 0.00 | 0.10 | 0.01 |
| 10:00 | 0.26 | 2.35 | 93.23 | 0.72 | 0.00 | 0.00 | 0.21 | 0.03 |
| 11:00 | 0.29 | 2.64 | 43.35 | 0.33 | 0.00 | 0.00 | 0.10 | 0.01 |
| 12:00 | 0.35 | 3.23 | 61.94 | 0.48 | 0.00 | 0.00 | 0.14 | 0.02 |
| 13:00 | 0.42 | 3.81 | 10,844.48 | 83.42 | 0.00 | 0.00 | 24.10 | 3.01 |
| 14:00 | 1.16 | 10.56 | 216.77 | 1.67 | 0.00 | 0.00 | 0.48 | 0.06 |
| 15:00 | 0.06 | 0.59 | 12.39 | 0.10 | 0.00 | 0.00 | 0.03 | 0.00 |
| 16:00 | 0.29 | 2.64 | 55.74 | 0.43 | 0.00 | 0.00 | 0.12 | 0.02 |
| 17:00 | 0.52 | 4.69 | 86.71 | 0.67 | 0.00 | 0.00 | 0.19 | 0.02 |
| 18:00 | 0.23 | 2.05 | 43.35 | 0.33 | 0.00 | 0.00 | 0.10 | 0.01 |
| 19:00 | 0.32 | 2.93 | 55.74 | 0.43 | 0.00 | 0.00 | 0.12 | 0.02 |
| 20:00 | 0.39 | 3.52 | 342.87 | 2.64 | 0.00 | 0.00 | 0.76 | 0.10 |
| 21:00 | 0.42 | 3.81 | 55.74 | 0.43 | 0.00 | 0.00 | 0.12 | 0.02 |
| 22:00 | 0.35 | 3.23 | 68.13 | 0.52 | 0.00 | 0.00 | 0.15 | 0.02 |
| 23:00 | 1.35 | 12.32 | 247.74 | 1.91 | 0.00 | 0.00 | 0.55 | 0.07 |